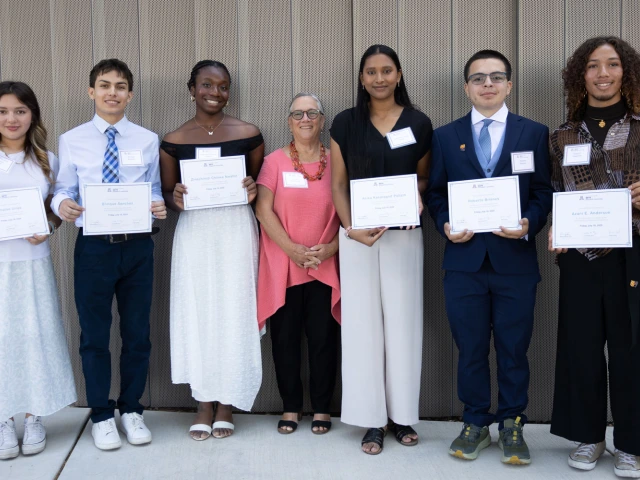
Image Brown Foundation increases impact of BIO5 KEYS Research Internship June 1, 2026 A generous gift from the Thomas R. Brown Foundations will now permanently fund five KEYS interns focused on the physical sciences. Read more in KEYS
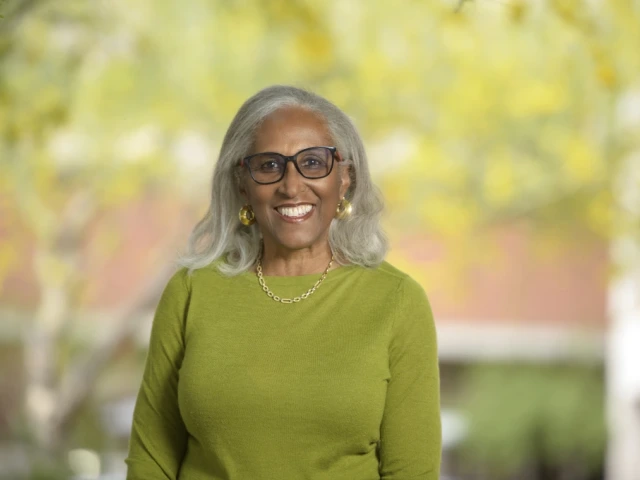
Image Researchers convene at U of A to tackle 'forever chemicals' at National PFAS Conference May 27, 2026 BIO5 member Paloma Beamer is helping lead the 2026 National PFAS Conference at the University of Arizona, bringing together researchers, regulators and community advocates to address “forever chemicals,” their health impacts and solutions for reducing exposure. Read more in U of A News
Image Reprogrammed glial cells might tell a different origin story for rare GI cancers May 22, 2026 BIO5 members Juanita Merchant and Travis Sawyer contributed to research at the University of Arizona showing that reprogrammed support cells in the digestive system may play a role in the development of rare gastrointestinal cancers, offering new insights into how these diseases begin. Read more in U of A Research & Partnerships
Image New $3.8M NIH grant funds research on 'mind after midnight' as a suicide risk factor May 21, 2026 BIO5 member Michael Grandner is leading new University of Arizona research supported by a $3.8 million National Institutes of Health grant exploring how being awake in the middle of the night may affect decision-making and suicide risk. Read more in U of A News
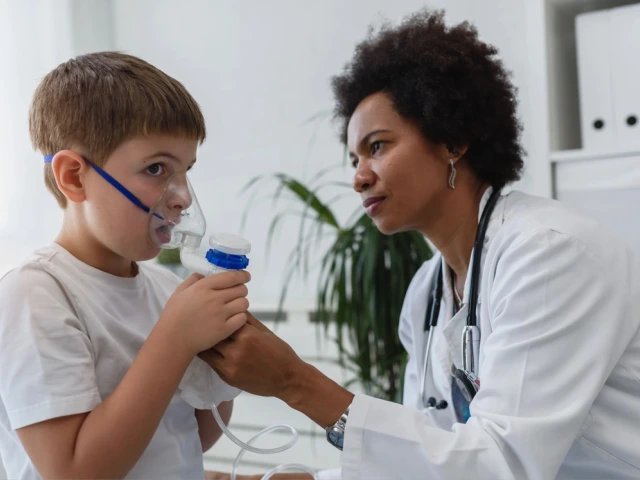
Image Antibiotic proves ineffective in treating wheezing in young children in the emergency room May 18, 2026 BIO5 member Fernando Martinez and his team contributed to new University of Arizona research showing that a commonly used antibiotic did not improve symptoms in young children treated for wheezing in the emergency room. Read more in U of A News
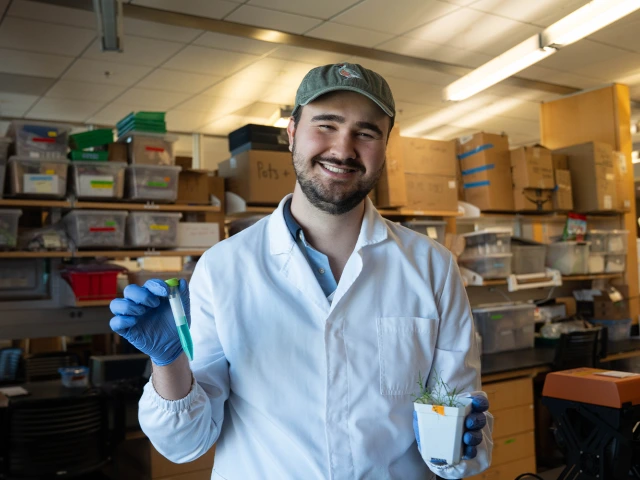
Image Turning toxic dirt into green gold May 13, 2026 Transitioning from his master’s to a doctoral program in environmental science, Jacob Galloway is using the "superpowers" of plants to clean toxic landscapes — pioneering a future where the metals in our technology are grown and recycled, not just mined. Read more
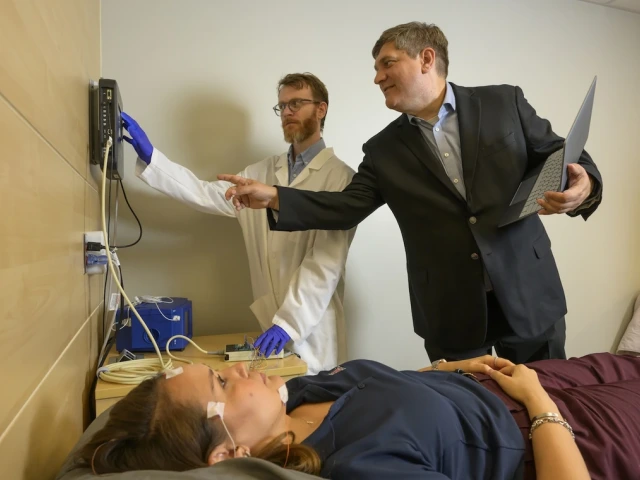
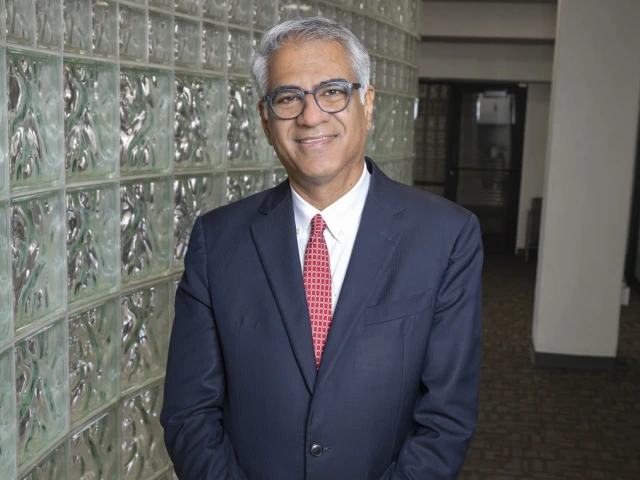
Image New study to help inform patient, physician choices for sleep apnea treatment May 11, 2026 BIO5 member Sairam Parthasarathy is leading a University of Arizona clinical trial funded by nearly $14 million to compare three widely used treatments for obstructive sleep apnea, with the goal of helping patients and physicians choose the most effective, patient-centered care. Read more in U of A News
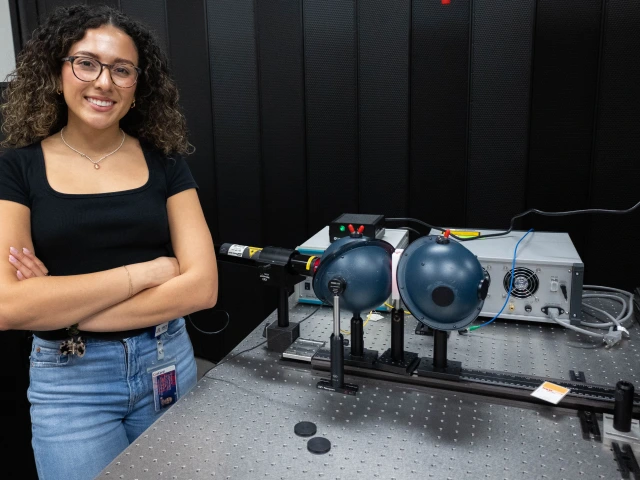
Image Focusing the lens on ovarian cancer May 11, 2026 Graduating with her master’s in biomedical engineering, Lynette Valenzuela uses light to study fallopian tube tissue — work that advances ovarian cancer detection while helping launch her career in medical innovation. Read more
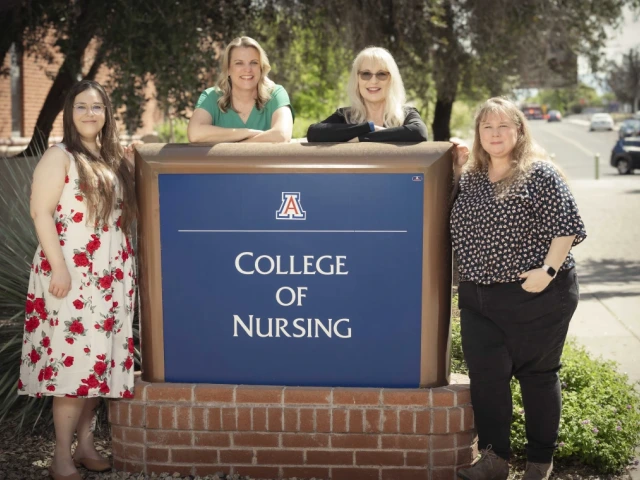
Image 4 from U of A honored as 2026 Fab 50 Tucson nurses May 8, 2026 BIO5 member Janine Hinton was named a 2026 Fab 50 Tucson nurse, recognized by peers for her leadership, mentorship and innovative work preparing future nurses through simulation and collaborative education at the University of Arizona. Read more in Health Sciences
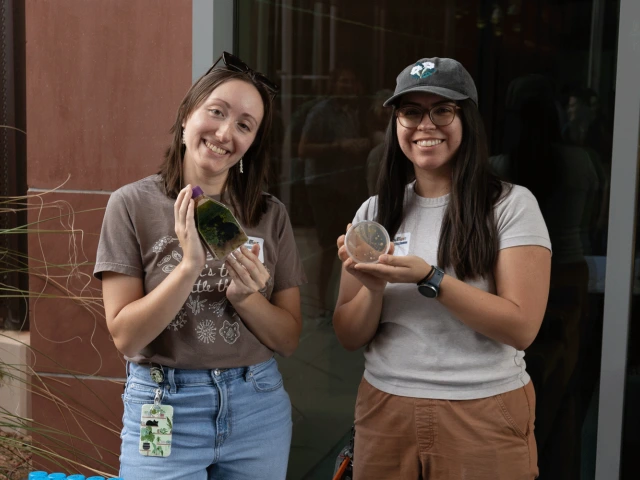
Image Photo Gallery: Behind BIO5 connects community with science May 8, 2026 At the third annual Behind BIO5 event, more than 100 community members explored collaborative research and connected with scientists at the University of Arizona. Read more